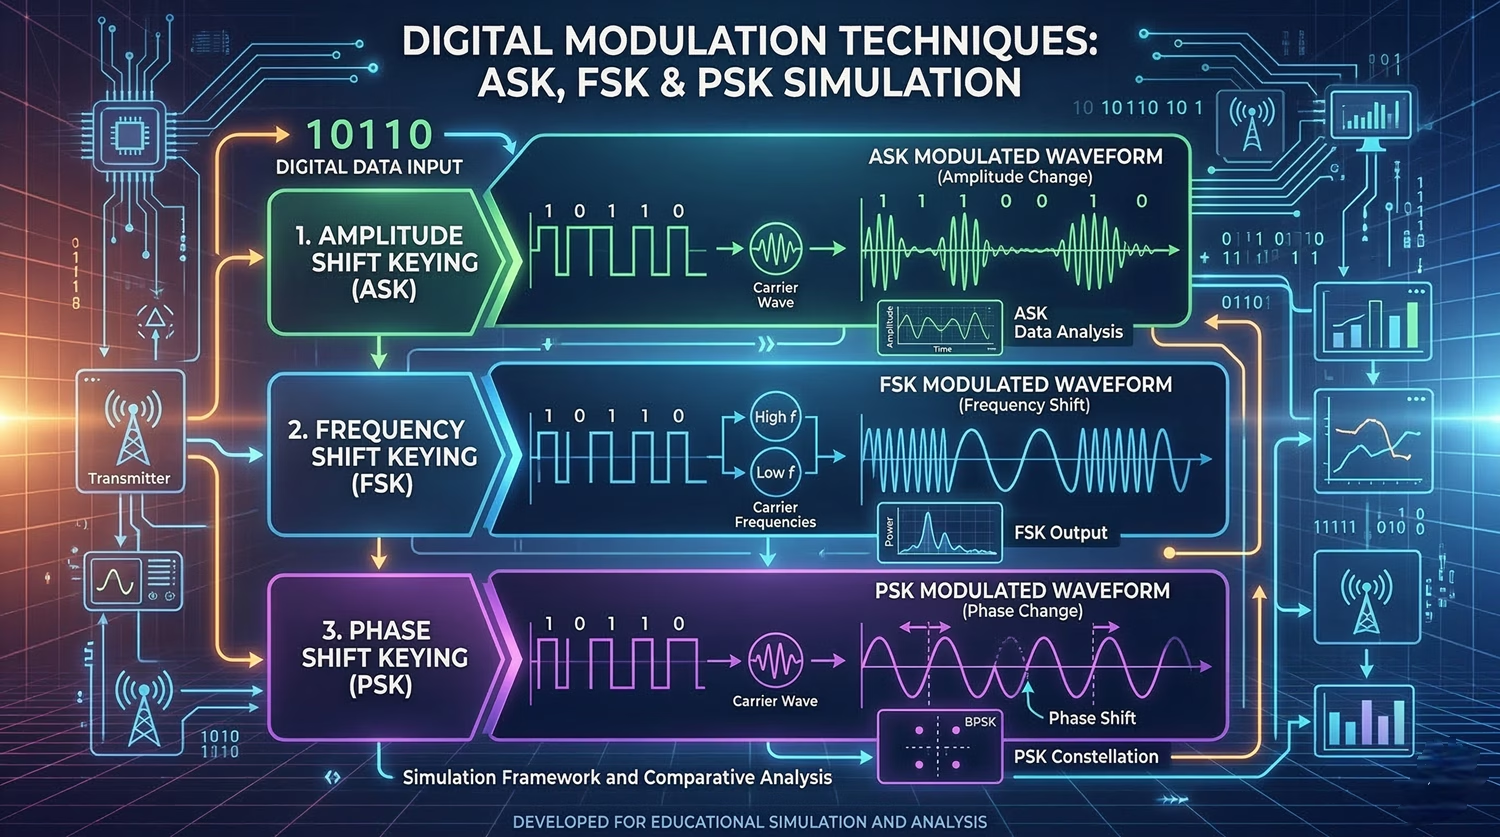
In the vast realm of digital communications, the way we send information has been revolutionized by digital modulation. But how does information, which is a sequence of bits (0s and 1s), travel over analog channels like air or cables? This is where digital modulation techniques come in.
In this post, we’ll dive deep into the technical implementation of the simulation above, built entirely with HTML5 Canvas and vanilla JavaScript. We’ll explore how the waveforms for ASK (Amplitude Shift Keying), FSK (Frequency Shift Keying), and PSK (Phase Shift Keying) are procedurally generated in real-time.
Understanding the Visualized Bit Stream
Before we jump into the technical details of the modulation, let’s first establish the data that’s being sent. The simulation initializes with a specific 12-bit sequence, which you can see scrolling across the top: 100101000101. This sequence represents our digital baseband signal. Each bit has a corresponding visual representation as a square wave, where `1` is high (positive voltage) and `0` is low (negative voltage).
Core Concept: HTML5 Canvas for Procedural Graphics
The entire animation is drawn programmatically on a <canvas> element. Rather than using static images or CSS animations, we’re calculating the visuals pixel-by-pixel based on trigonometric functions. This is what allows for the smooth scrolling and, crucially, the interactivity where you can change the bits on the fly and immediately see the resultant waveforms.
We utilize a core render() loop tied to the browser’s requestAnimationFrame API. On every frame, the canvas is cleared, grid lines are drawn, and the pre-calculated waveform buffers are shifted based on the current globalTime variable.
// Example of the render loop concept
function render() {
    ctx.clearRect(0, 0, width, height);
    drawGrid();
    drawWaveforms(globalTime);

    globalTime += speedModifier;
    requestAnimationFrame(render);
}
Technical Breakdown of the Modulation Techniques
Let’s get into the nitty-gritty of how each of the mathematical wave formulas translates into the pixels you see on the screen.
The Carrier Signal
The carrier signal is the high-frequency analog wave that we will “modulate” with our data. It’s a pure, unadulterated sine wave. It is calculated using the standard formula sin(2 * PI * fc * t), where fc is the carrier frequency (in our code, defined as 4 cycles per bit duration), and t is normalized time.
ASK (Amplitude Shift Keying)
ASK modifies the amplitude of the carrier wave based on the digital signal. In our simulation, a 1 results in a high-amplitude wave (multiplied by 1.0), and a 0 results in a lower-amplitude wave (multiplied by 0.3). The math is remarkably simple: we simply multiply the base carrier equation by our amplitude modifier.
FSK (Frequency Shift Keying)
FSK shifts between two different frequencies to represent 0 and 1. Generating FSK continuously, without any sudden jumps, requires “continuous phase integration.” If we simply hot-swapped the frequency variable in the sine function, the wave would fracture at the bit boundaries. Instead, we continuously add a phase increment to an accumulator variable. A high bit adds a larger increment (higher frequency), while a low bit adds a smaller increment.
PSK (Phase Shift Keying)
PSK keeps the frequency and amplitude constant but flips the phase of the wave by 180 degrees whenever we encounter a 0 bit. In our wave formula, we inject a phaseShift variable. It is set to 0 radians for a `1` bit and Math.PI radians (180 degrees) for a `0` bit. This immediate phase reversal creates the distinct sharp peaks/valleys at bit transitions.
Interactivity: Bringing the Canvas to Life
We wanted this to be an active learning tool, not just a static video. Two major components make this possible:
- The Diagnostic Playhead: A vertical scanning line calculates the absolute pixel position relative to the global scroll time. We reverse-engineer this coordinate to determine exactly which bit is currently intersecting the scanner, allowing us to update the right-hand diagnostic labels in real-time.
- Interactive Bit Toggling: By attaching a
clicklistener to the Canvas, we capture the mouse’s X coordinate, offset it by the left margin and the current animation time frame, and isolate the exact bit index the user clicked. We flip that bit in our primary data array and immediately callgenerateBuffers()to seamlessly recalculate the trigonometric geometries without interrupting the animation loop.
Conclusion
By leveraging native browser APIs like Canvas and requestAnimationFrame, we can build highly performant, interactive educational tools right in the browser. At Rezyo.in, we believe in building visual mental models to understand complex engineering concepts. Try tweaking the bits in the interactive explorer above and observe how the spectral characteristics change instantly!


